Statistical Analysis: Methods, Types & its Future Importance
Contents
Introduction
Statistics is a scientific field that employs tools and techniques to handle vast amounts of data. It involves gathering, sorting, analysing, and interpreting numerical data to draw conclusions about populations based on selected samples. Businesses often use SPSS data analysis to solve problems and forecast future trends by organising information. The process encompasses data collection, interpretation, and presentation, enabling the resolution of complex issues. Statistical analysis assigns significance to seemingly inconsequential data or figures, aiding in decision-making. This blog aims to define statistical analysis, explore its various types and methods, and emphasise its significance in data handling.
What is statistical analysis?
Statistical analysis refers to the process of collecting, organising, interpreting, and drawing conclusions from data using statistical methods and techniques. It involves analysing numerical data to uncover patterns, relationships, and trends, as well as making inferences and predictions based on the data. Statistical analysis is used in various fields, including research, business, finance, healthcare, and the social sciences, to support decision-making, hypothesis testing, and drawing meaningful insights from data.
Statistical Analysis Types
There are two primary categories of statistics: descriptive statistics and inferential statistics.
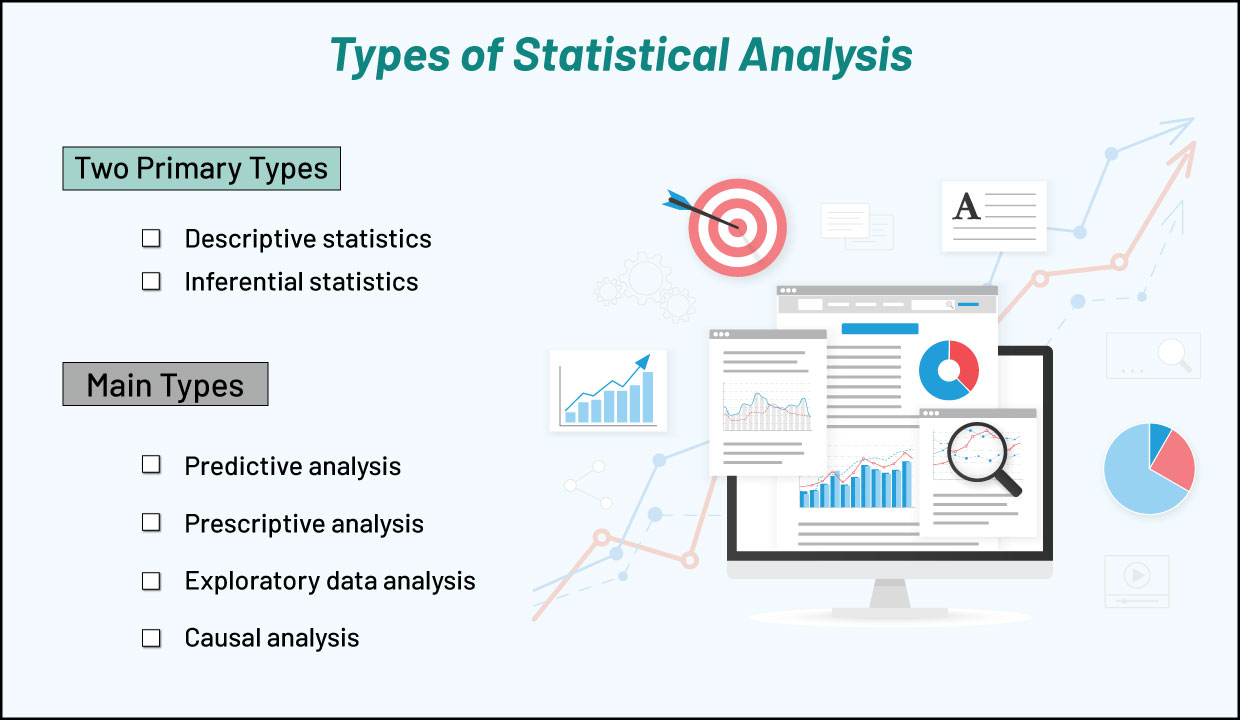
1. Descriptive statistics involves the collection, organisation, analysis, and summarization of data sets in a comprehensible format, such as charts, graphs, and tables. Its purpose is to make large data sets presentable, reducing complexity and aiding analysts in understanding the data. The summary can take a quantitative or visual form.
2. Inferential statistics draw conclusions about a larger population based on the analysis and findings obtained from sample data. By using this approach, the process becomes more cost-efficient and time-efficient. It typically involves developing interval estimates and point estimates for conducting the analysis.
In addition to these main types, there are several other types of statistical analysis:
1. Predictive analysis
This analysis involves forecasting future events by leveraging past and current data. It utilises tools such as machine learning, data mining, big data, predictive modelling, artificial intelligence, and simulations.
2. Prescriptive analysis
This analysis aims to recommend the best possible outcomes based on the assessed data. It assists in making informed decisions and promotes efficient decision-making.
3. Exploratory data analysis
EDA is a statistical approach that focuses on studying data sets to identify their key characteristics. It often employs statistical graphics and other data visualisation techniques.
4. Causal analysis
This type of analysis concentrates on understanding cause-and-effect relationships. It seeks to determine the reasons behind events and failures in business and professional activities. By analysing data, causal analysis helps in comprehending why something did not work out as intended.
Methods of Statistical Analysis
1. Mean
The mean, also known as the average, is a simple and widely used method for analysing data. It provides the average value of a dataset. In statistics, the term "mean" is commonly used to refer to the average. To calculate the mean, you add up all the data values and divide the sum by the total number of data points. While the mean is a commonly used method, it is recommended to complement it with other methods for effective decision-making.
2. Standard Deviation
The standard deviation is a popular statistical analysis tool to provide SPSS help used to measure the extent to which a set of values deviates from the mean. A low standard deviation indicates that the values are close to the mean, while a high standard deviation indicates significant deviations from the mean.
3. Regression
Regression analysis helps us understand the relationship between two or more variables used in an analysis. It demonstrates how one variable depends on the others and the mutual influence they have on each other. Simple linear regression involves using a single independent variable to interpret the dependent variable, while multiple linear regression utilises multiple independent variables to interpret the outcome.
4. Hypothesis Testing
Hypothesis testing is a method used to validate and authenticate hypotheses, outcomes, or arguments. It involves formulating an assumption at the beginning of the research, and after conducting the test and obtaining a result, the belief can be proven true or false. Hypothesis testing allows us to determine whether the null hypothesis or alternative hypothesis holds true.
Importance of Data Analysis in the Future
As data continues to be generated at an exponential rate across various industries and companies, data analysis is becoming an increasingly crucial discipline. The ability to make sense of this data and evaluate it is vital for effective decision-making. Furthermore, analysing patterns and trends within the data can be utilised to forecast future events and outcomes.
Forecasting time series data is another significant application of data analysis. This type of analysis uses historical data to predict future values. Precise forecasting of future trends is particularly valuable in fields such as banking and economics. Statistical research is another important aspect of data analysis, involving the development of models and algorithms for predicting future results.
A valuable tool for data analysis is SWOT analysis, which identifies a company's or industry's strengths, weaknesses, opportunities, and threats. By comparing return on investment (ROI) and using this data, informed decisions can be made regarding a company's market positioning and how to adapt to changing market conditions.
Having the ability to process and make sense of data provides a significant advantage when making informed decisions and predictions.
How to learn data analysis with SPSS
To learn data analysis with SPSS (Statistical Package for the Social Sciences), there are several steps you can follow. Firstly, familiarise yourself with the SPSS software interface and learn the basic functions and features. This can be done through online tutorials, user guides, or training courses offered by SPSS or other educational platforms.
Next, gain a solid understanding of statistical concepts and methodologies used in data analysis. This includes learning about descriptive statistics, inferential statistics, hypothesis testing, regression analysis, and other relevant techniques. Numerous online resources, textbooks, and courses are available to help you grasp these concepts.
Practise using SPSS by working on real-world datasets. This hands-on experience will help you apply the statistical techniques you've learned and gain proficiency in using the software. Start with simple analyses and gradually progress to more complex ones as you build your skills.
Conclusion
This blog explores various statistical analysis methods and the importance of data analysis in the future. Industries such as hotels, clothing design, music stores, vendors, marketing, and politics heavily rely on data analysis to maintain a competitive edge. Additionally, fields like medicine and psychology also benefit from statistical analysis. While data can be valuable on its own, statistical analysis plays a vital role in extracting meaningful insights. To thrive in data analysis with SPSS in statistical consulting companies, it is essential to cultivate a strong statistical foundation, gain practical experience with SPSS, engage in continuous learning, build a network, and acquire relevant credentials.
Submit a Comment
Your email address will not be published. Required fields are marked *
Recent Posts


Comments(0)