SPSS: A Crucial Tool for Quantitative Data Analysis in Social Science
Contents
Introduction
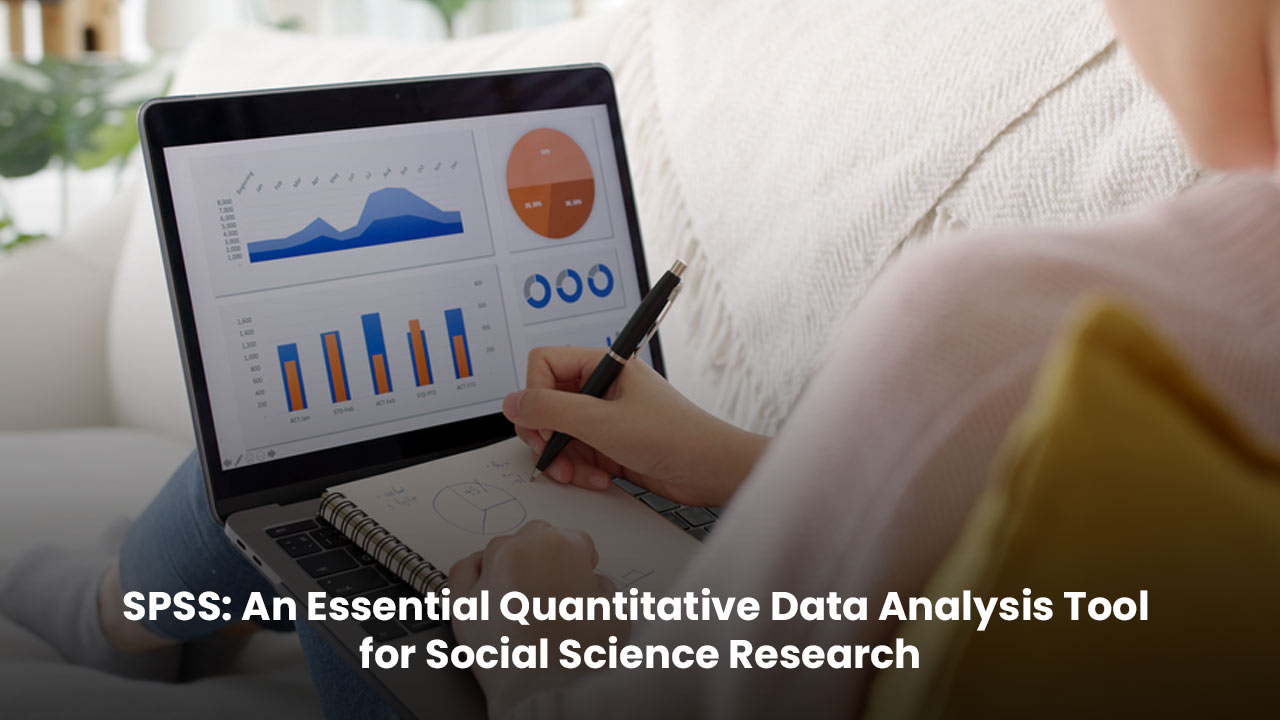
In recent years, it is worth noting that researchers in the field of social sciences have demonstrated a strong involvement of different software programs in their regular methodological research activities, whether it is for writing their research papers or thesis, relevant materials, Be it for searching online or any analytical work. Realising the same, IBM SPSS or Statistical Package for Social Science is one of the most widely used statistical analysis software by social scientists worldwide. Since its inception about fifty years ago, it has undergone many changes as per the need of social science researchers
The need for accuracy and completeness in data representation in quantitative data analysis forced its creators to make it feature-rich and user-friendly. Within this phase, it has also developed into a powerful data analysis tool for other disciplines of study. Its scope of use is so vast that people from different fields, from medicine, engineering, business, and education, are using SPSS for their statistical analysis needs. With SPSS help you can dig deeper into the analyst's data and make it a more efficient tool than other available spreadsheets, databases or standard multi-dimensional tools. This blog's aims to elaborate on Statistical Package for Social Sciences, widely known as SPSS, as an effective tool for quantitative data analysis in social sciences. Let's go ahead...
SPSS introduction
A significant role of technology has emerged in social science research. Earlier researchers had to do much analytical work to analyse quantitative data. With this in mind, the Statistical Package for the Social Sciences is widely known as SPSS, which was initially developed by Norman H. Nye, a social scientist, along with two of his colleagues, Dale H. Bent and C. Hadleigh Hull—created in 1968 with Stanford University. Later, in 2009, IBM purchased the software, and it is now known as IBM SPSS. Written by the developers themselves, The Introductory Manual for SPSS has been described as one of the most influential books on sociology ever written, with ease-of-use statistical analysis features for the general researcher. Other vital elements of SPSS include data management and data documentation. SPSS is a powerful and user-friendly software package for the statistical analysis of all data types. Students and researchers of sociology, psychology, economics, business studies, medicine, engineering, and other disciplines mainly use this program. Apart from this, various public, private and non-governmental organisations also use SPSS for multiple projects. For evaluating and anticipating consumer behavior, marketing and survey firms frequently choose SPSS.
Social science researchers are often required to deal with large amounts of data. Mainly these data are collected from online or offline surveys, interviews, group discussions, or observations. The most significant advantage of SPSS is that the program is designed to handle an extensive data set with many variables. It has all the flexibility of graphical representation as well as multiple analysis of data.
In today's world, data means everything, and people are more inclined to use computer software for any data analysis. Data analysis software should have all the essential features an analyst needs. There are many computer software packages available for quantitative data analysis. Still, SPSS stands out because of its utility and excellent features, which compel a researcher to use it even when some free alternatives are available in the market.
Methodology
No specific fieldwork is done for the study. This paper is designed with a logical explanatory model adopted from SPSS data analysis related to various empirical data and secondary data sources available. Specifically, our objective directed us to such a methodological approach.
The primary data sources rely on the authors' personal experiences using SPSS for various social-science-related research work done earlier. No other methodological approach was suitable for such a thought-provoking task. The secondary data sources such as journal articles, symposium papers, and other related publications selected to further this study are considered based on qualities such as authentic data source, accuracy and consistency of data, and the author's background. Develop the proper intention of the Direct study explanation from available data.
Statistics and Quantitative Analysis
Statistics is collecting, organising and analysing numerical data and interpreting and presenting them as applicable to a scientific, industrial or social problem. In another way, statistics is a mathematical process to interpret essential information from collected data, especially using a group of samples in a representative population.
Quantitative analysis is a statistical method of analysing numerical data, polls, questionnaires and surveys collected online or offline or considering pre-existing statistical data more mathematically with the help of computational techniques. The analysed findings are further generalised across different groups or explain a particular incident.
In social science research, quantitative analysis determines the relationship between an independent and dependent variables within a given population. The values of the independent variables can be manipulated; More precise values can be controlled or changed to observe the effect on the dependent variable.
Tools for statistical analysis of quantitative data
In today's world, most social science researchers use quantitative data analysis for their studies. The list of software packages for performing such an analysis is also extensive. R, PSPP, Stata, SAS, SPlus, JASP, and BMDP are some of the general-purpose statistical analysis software packages available in the market. Some of these are open source, and the rest are under commercial licences.
Excel, a widely used spreadsheet software by Microsoft, also allows quantitative data analysis through add-on modules. Although these options could be more user-friendly, there are alternatives for SPSS.
Most educational and non-educational institutions use SPSS because of its user-friendly features. SPSS is not necessarily the best quantitative data analysis tool, but it has some advantages over other software packages. Even some other packages have features that are better than SPSS. The three primary computer platforms—Windows, MacOS X, and Linux—all support SPSS.
Features of SPSS
The first and foremost feature of SPSS is that it has been developed specifically for social sciences for people with non-technical backgrounds, so no prior knowledge of a programming language is required to start the program. As a result, the program is user-friendly and readily applicable to any quantitative analysis.
Its data management capability is another great feature that makes it a top choice for researchers worldwide. The program has exceptional report-generation capabilities.
Comprehensiveness and flexibility in quantitative data analysis are essential to choosing this program over any other option. Authorisation, collaboration and deployment of survey data for strategic data mining for statistical analysis are reasons for using SPSS in social science research. Knowing the basic concepts of SPSS operation makes it easy for the researcher to use it for practical quantitative data analysis. Thus it helps the researcher to face any difficulty during the process.
SPSS needs to define variables and create cases by appropriately inputting the data within these variables. There are mainly four types of variables in the SPSS data sheet. These are the independent, dependent, intermediate, and moderator variables. In layperson's terms, an independent variable is a cause. Its value is independent of any other variable in a study. The dependent variable is an effect whose value depends on any hang in the independent variable. The case of an intermediate variable (sometimes called a mediating variable) refers to a hypothetical variable typically used within research to explain causal links between other variables. Finally, the moderating variable is the variable that can change the association between the independent and dependent variables. It is essential to identify the variables.
Conclusion
This blog covers broad aspects of how it has advanced from its foundation as a statistical analysis tool to a leading choice for researchers in various fields of study. It is essential for researchers, especially new researchers, to know about SPSS and why they should use it. This study combined personal experiences of using SPSS and the arguments other SPSS users have expressed in various pieces of the literature. Various works of literature related to SPSS and social sciences are discussed throughout the paper. The most relevant has been talked about. The features and critical advantages are depicted so that one can relate the tool to their research works. SPSS Statistics excels at drawing conclusions and predictions from user data. It is the fastest at handling data manipulation and statistical procedures compared to many non-statistical programs. Along with the statistical analysis, its features include data management and documentation. In conclusion, SPSS is considered one of the most vital and influential statistical tools for quantitative data analysis.
Submit a Comment
Your email address will not be published. Required fields are marked *
Recent Posts


Comments(0)