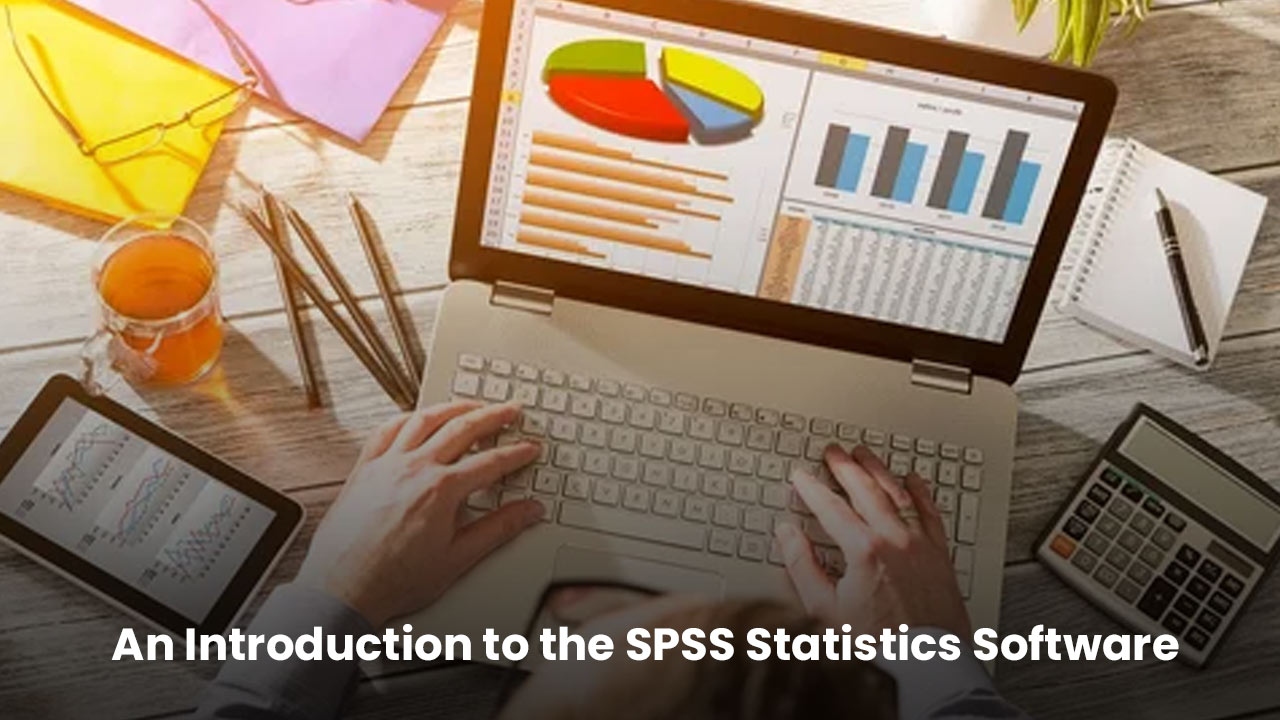
An Introduction to the SPSS Statistics Software
Contents
Introduction
Countless business establishments across the globe are using data analysis techniques to solve problems and make better decisions. The successful ones use advanced statistical tools to provide insights into their systems and those of competitors. It is no wonder, therefore, that businesses have come up with a significant demand for robust data analysis tools that can help them deal with large amounts of information and make swift decisions on how best to go about solving their respective problems. When it comes to statistics and data, you might come across many different types of software. Some of these software packages are easy to use and understand, while others require more time and inclination from the user. Most business professionals prefer SPSS because it is one of the most commonly used statistical software packages worldwide. In this blog, we will find out: What SPSS software is, its features, types, use cases, and advantages of SPSS help.
What is SPSS?
It's an open-source software platform developed by IBM to run statistical analyses on various datasets. SPSS can run eight different statistical algorithms in seven different programming languages. It is also used for data mining, marketing research, surveys, and more! SPSS was originally named SPSS Inc. in 1968. It was launched by IBM acquired it in 2009. Its simplicity, easy-to-follow command language, and well-documented user manual make SPSS popular. Government bodies, educational institutions, survey companies, market researchers, marketing organisations, health researchers, data miners, and many more use it to analyse survey data. SPSS software is widely used in many disciplines.
The main functionalities offered in SPSS are:
- Statistical programs for quantitative data analysis - include frequency, cross-tabulation, and bivariate statistics.
- Modeler program that allows predictive modeling. Using advanced statistical procedures, researchers can build and validate predictive models.
- Text analysis helps you gain insights from qualitative input through open-ended questionnaires.
- Visualization Designer allows researchers to use their data for various visual presentations.
SPSS features that make it an essential analysis tool:-
- For research, experimentation, and decision-making, SPSS is a popular tool. It is one of the most widely used statistical software worldwide for its attractive features.
- The data analysis software SPSS is a powerful tool that enables you to perform descriptive, predictive, and various statistical procedures.
- The SPSS software has a built-in database management system and a graphical user interface that non-technical users can use. Additionally, it has an integrated help feature that gives users all the help they need when working with the software.
- The SPSS software is designed to handle large datasets by allowing users to conduct complex statistical analyses on datasets containing thousands of variables. The program also offers flexible solution modeling options for complex data problems.
- In addition to performing statistical analyses on large datasets, SPSS also allows users to perform exploratory data analysis with spss on smaller datasets by creating multiple layers in their models. This feature enables researchers to test different hypotheses about relationships between variables before deciding which variables should be included in their models.
- Another feature that distinguishes SPSS from other statistical packages is its ability to easily handle large data sets. It allows users to perform large-scale exploratory data analysis on a variety of different types of data, including text, numeric, categorical, and hybrid variables, as well as time series data types such as time series surveys or time series polls.
What You Need to Know About SPSS Types
1. Variable View
Name : This is a column field that accepts a unique ID which helps in sorting the data. Some parameters to sort the data are name, sex, gender, educational qualification, designation, etc.
Label : This gives the title and allows you to add special characters.
Type : It is helpful to separate the type of data being used.
Width : The length of characters can be measured here.
Decimal : It helps us to understand how to define the digits required after the decimal.
Price : The user enters the price here.
Missing : Data unnecessary for analysis will be ignored.
Align : This is for left- or proper alignment.
Measurement : This measures the data entered into the instrument, such as cardinal, ordinal, and nominal.
2. Data view
The data view is displayed in the form of rows and columns. Data can be imported from a file or manually entered.
SPSS by Industry: Use Cases
The statistics used in these industries are usually highly complex and involve many hundreds of variables. These statistics include profit margins, sales performance, time differences, and costs. SPSS provides an effective way to manage all these complex statistical factors. Let us look at the four major industries where SPSS is mainly used.
1. Market Research
When you're a business, you need to make decisions that affect your enterprise. But those decisions get made based on data, not hunches or gut feelings. That's why you want reliable insights — that is, accurate information based on sound analysis of your data that can help you reach conclusions and make sound business decisions.
2. Education
The best way for any educational institution to attract new students, retain current students and place them in internships or jobs is to have an effective system for recruiting. SPSS software provides a platform for analysing data, allowing faculty members at all levels of an educational organisation to identify each student's potential better.
3. Healthcare
Health care is a delicate balance between the patient's needs and the organisation's finances and efficiency. To provide good healthcare, we need to solve a lot of issues. Improving our ability to analyse data can help us make better decisions based on trends and patterns that can lead to more effective outcomes.
Data analysis is an integral part of healthcare. Data-based evidence and research are the lifeblood of medical research and often the driver of clinical decision-making. The analysis process involves a lot of critical decisions that affect patient outcomes.
4. Retail
The retail industry relies heavily on analytics, from initial stock planning to forecasting future trends. It's becoming increasingly important for retailers to monitor their customers' buying habits with the rise in social networking and review sites.
Collecting and analysing big data can be challenging for small and large businesses. But it's not that hard once you know how to do it with the right tools for the job – like SPSS!
With the help of SPSS Statistics and automation, you can get innovative insights from customers. Data is collected from past purchasing behavior, online shopping patterns, and demographics. The resulting information will help you understand what segment of customers will buy from you based on their behaviors and demographics.

Advantages of Using SPSS
There are many advantages of using SPSS, and these are the five significant advantages: it is straightforward to learn and use, it saves a lot of time and effort, it is compatible with a wide range of programs, it can merge files that are in different formats without any problem, and it allows you to export files in other formats.
- SPSS is a compelling statistical package. It offers reliable and fast answers to any statistical problem, and it's dynamic, with helpful tables and graphs. Since it provides a wide variety of languages, many people can access SPSS.
- Effective data management is one of the essential features of SPSS. It allows users to manage and store all the variables in their databases for easy analysis.
- The chances of errors are small with SPSS because it has advanced checking procedures that help detect errors in data and variables before they reach the final analysis stage.
- One of the most accessible statistical tools to analyse data is SPSS, which can be used by people who are not statistics or data analysis experts.
Conclusion
This blog shows what SPSS is, its features, types, uses, and benefits. From planning, data collection, data analysis, report creation, and deployment, SPSS assists scientists, researchers, business analysts, managers, and marketers. It doesn't matter what your business objectives are, SPSS is one of the best statistical analysis tools for analysing data. To learn how this tool can benefit your company, get in touch with SPSS help services. Experts from spss consulting services will support individuals in their decision-making and lessen the burden on management. The specialist also aids in tasks connected to forecasting.
Submit a Comment
Your email address will not be published. Required fields are marked *
Recent Posts


Comments(0)